Guess the size of an atomic bomb and an iOS supply chain attack
Disclaimer: Nothing in this blog is related to the author’s current day-to-day work. The content is neither affiliated nor sponsored by any companies. The story in this post is based on a true event that happened in two parts, six years apart, and is full of nostalgia.
In 1945, a famous physicist Enrico Fermi designed an experiment to measure the energy of an atomic bomb*:
“About 40 seconds after the explosion the air blast reached me. I tried to estimate its strength by dropping from about six feet small pieces of paper before, during, and after the passage of the blast wave.” …… “The shift was about 2 1/2 meters, which, at the time, I estimated to correspond to the blast that would be produced by ten thousand tons of T.N.T.” – Wikipedia
How did it relate to the iOS supply chain attack? Let’s jump ahead to 2015.
Part I: 2015
Back to 2015, I had a chance to join a talented team and we worked on DNS traffic analysis and machine learning models for cybersecurity. One day, our experimental anomaly detection system discovered a domain name we had never seen before, but which experienced a sudden traffic spike. It was init.icloud-analysis.com, which was later identified as the primary command-and-control domain for the XcodeGhost malware *, a large scale iOS supply chain attack.
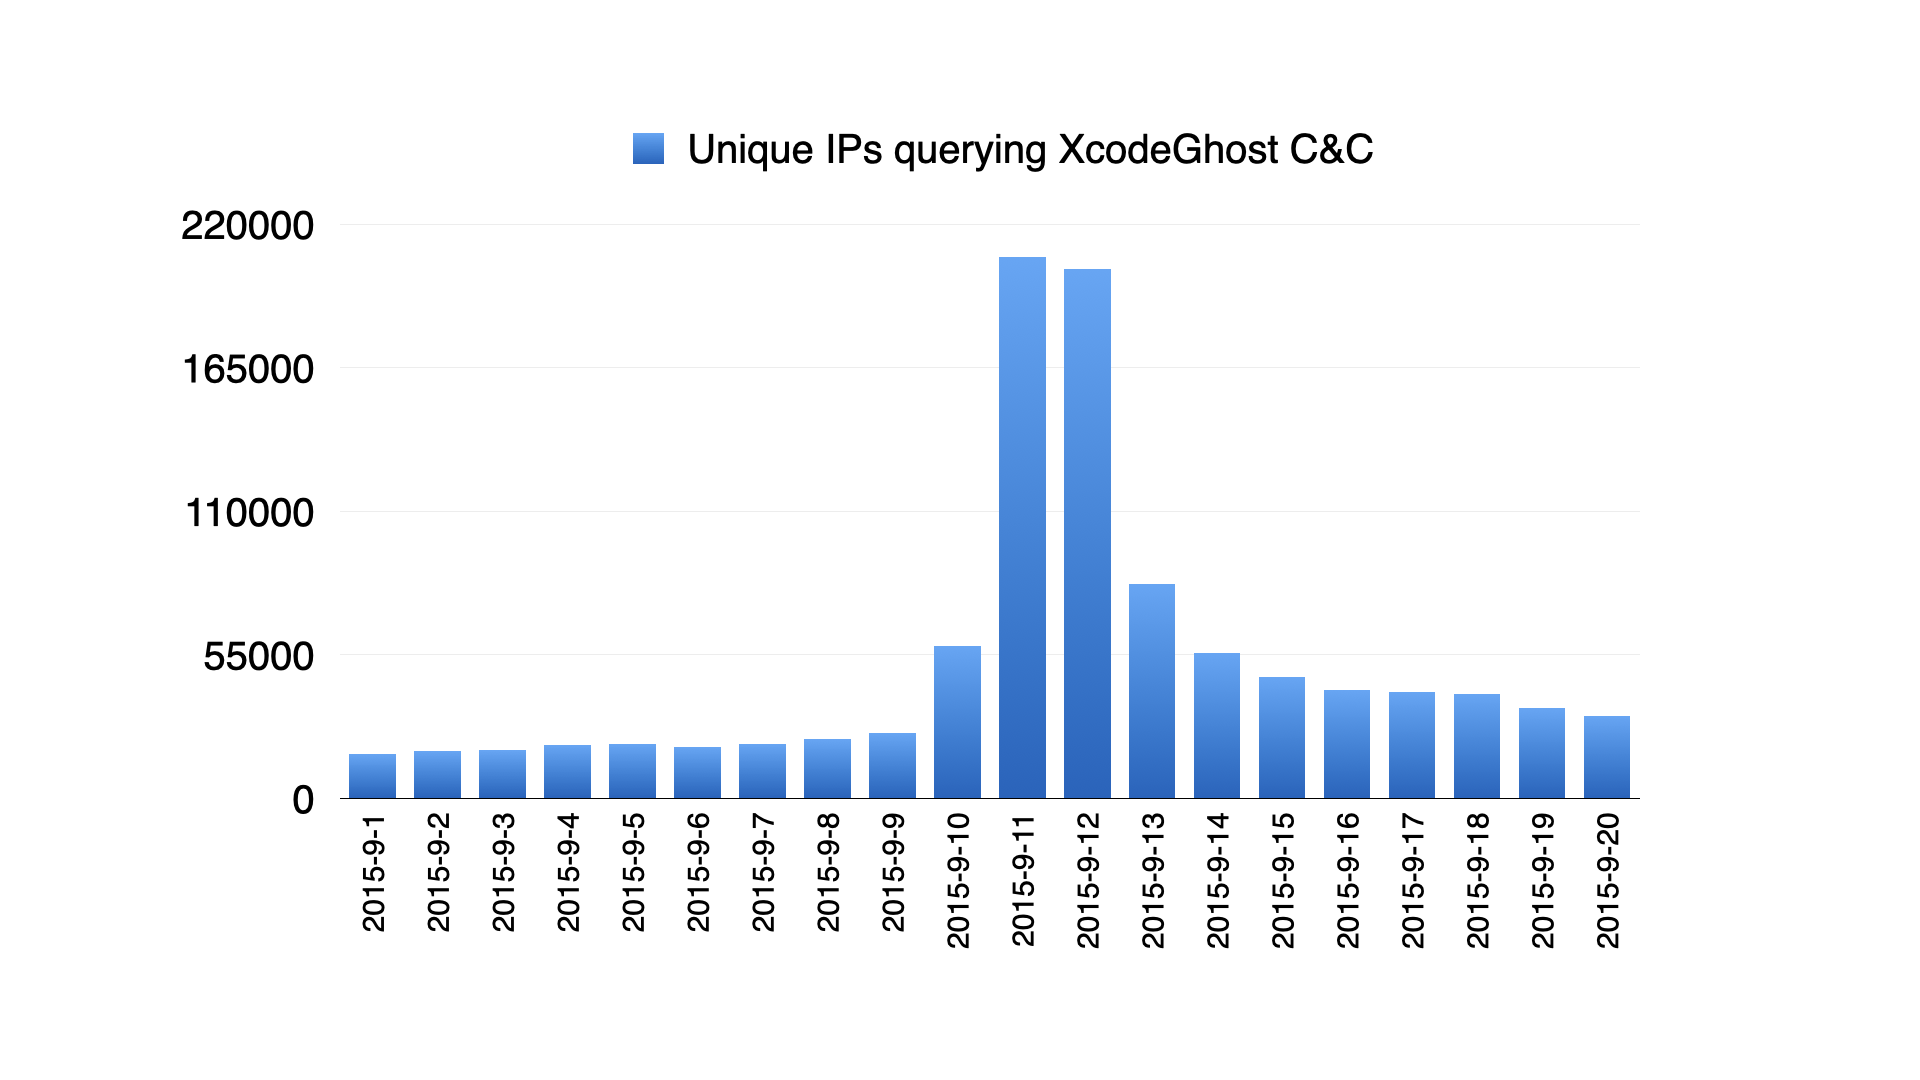
We knew it would go viral because it was an anomaly that caused a spike of 220k unique IPs in a matter of hours, so we had to figure out the answer for our customers so they could take action as soon as possible:
What was the
XcodeGhostimpact, measured in number of infected devices?
Fortunately, we had collected DNS traffic data from our global collaborative customers and discovered that it was trending globally. However, DNS traffic data was the only source of information. It was sampled at random, with a strong regional bias, and it lacked any device information, whether iOS or Android, PC or mobile. With such limited data, how could we calculate the number of infected devices?
Answering the question, “Customers won’t need the exact number to make decisions, right?” led to the breakthrough. No, they won’t need it because they’d take actions whether there were 9 million or 20 million. As a result, Fermi estimation * provided a clever solution.
“An example is Enrico Fermi’s estimate of the strength of the atomic bomb that detonated at the Trinity test, based on the distance traveled by pieces of paper he dropped from his hand during the blast. Fermi’s estimate of 10 kilotons of TNT was well within an order of magnitude of the now-accepted value of 21 kilotons.” Wikipedia
*
The exact procedure of Fermi’s example included some physics details* but long story short, we would need to find all scaling factors to connect our observations in the sample data to the target measurement. We needed these three factors to guess how the entire dataset would look:
- DNS data sampling rate
- sampling bias in different regions
- number of iOS devices of each client IP
The first could tell the global scale of data sampling; the second could correct for bias; and the third was required because DNS data only records its client IP, which could be a router, phone station, school network, etc., but we wanted the number of iOS devices.
The first was simple, or we had little to do, but we had to accept 1%, as agreed with our customers. This 1% also included data collection efficiency. As a result, it had to be 1%.
The sampling bias by region was tricky: in 2015, we only had data from the EU, Latin America, Australia, and South Asia, with no idea of North America or China, the world’s two largest telecom regions. Fortunately, we had some snapshot samples from a pilot program with a list of customers, including customers from North America and China, about a year ago. Although data from North America and China were discontinued, some other customers remained with the program, so we used them as anchor points: we compared the ratio of North American and China vs anchor customers from a year ago to the global data vs anchor customers in 2015, and we concluded that the sampling bias rate was about 0.5.
The number of iOS devices for each client IP was solved by using probability. We studied that on average each IP had about 2 mobile devices, which could be either Android or iOS, and that the Android vs iOS market share was roughly 1:1. So, what was the expected number of iOS devices when we discovered the XcodeGhost domain, indicating at least one iOS device behind this IP? The answer was 1.33. Please consider it a good exercise and have some fun with it.
So the estimated number of XcodeGhost infected devices became
Why do we need the Fermi estimation method if it appeared to be just some common sense factors? The method could provide an answer to the following question: what about the upper and lower limits? According to Fermi’s estimation, it was overestimating or underestimating by a factor of 2 to logarithmic scale. For 3 scaling factors, the upper limit should be $58.7 M \times 2^{\sqrt{3}} = 195.0 M$ and the lower limit $58.7 M \div 2^{\sqrt{3}} = 17.7 M$, so we could report to our customers:
The global number of
XcodeGhostinfected devices was approximately 59 million, with a range of 18 million to 195 million, so please take action.
Yes, there could be up to 200 million infected devices! Without knowing each step above, it was impossible to believe.
Part II: 2021
How time flies! With just a finger snap of time, the company was acquired in 2017, the team also moved forward. Let’s fast forward to 2021, when there was a law suit between Epic Games and Apple, and some related Apple internal emails mentioning XcodeGhost were revealed as evidence in court:
“In total, 128M customers have downloaded the 2500+ apps that were affected LTD. Those customers drove 203M downloads of the 2500+ affected apps LTD,”
“China represents 55% of customers and 66% of downloads. As you can see, a significant number (18M customers) are affected in the US.”
The mystery of the number of XcodeGhost infected devices has been solved. We had a very accurate estimation with a tiny little biased sample of DNS traffic! It was within an order of magnitude of Fermi’s 10 kilotons of TNT for the true value of 21 kilotons!
Summary
The population distribution could also be used to estimate regional sampling bias because we could assume one device per person, yielding a factor of about 0.3. We chose the anchor method so that we could better justify it to customers. Actually, a factor of 0.3 or 0.5 was sufficient for this task.
Surely, some details were changed to simplify the story. We were also looking for the source of this infection.
The correlation model, later known as domain2vec, provided an answer. The anomaly domain init.icloud-analysis.com had a numerical dense vector as its distributed representation, and its learned vector had small open angles with a few other vectors for domains of popular Chinese apps. This observation also reminded us of the regional sampling bias.
Estimation with limited information, or “Guesstimation,” is widely used in many fields, including quantitative trading (such as market-sizing), astronomy (such as the number of planets on which aliens can live), and computer science (like the number of rows in a large table to optimize SQL queries). In each field, an estimate within an order of magnitude is considered accurate for making strategic decisions.
Reference
- Trinity Test https://en.wikipedia.org/wiki/Trinity_(nuclear_test)
- XcodeGhost https://en.wikipedia.org/wiki/XcodeGhost
- Fermi Problem https://en.wikipedia.org/wiki/Fermi_problem
- How exactly Fermi estimated the atomic bomb https://physics.stackexchange.com/questions/19567/how-did-enrico-fermi-calculate-the-classical-fermi-problem
- Security firm publishes list of some of the iOS apps infected by XcodeGhost https://9to5mac.com/2015/09/21/xcodeghost-infected-apps/
- Emails reveal 128 million iOS users were affected by ‘XcodeGhost’ malware https://9to5mac.com/2021/05/07/emails-reveal-128-million-ios-users-were-affected-by-xcodeghost-malware/
- Archive post of XcodeGhost discovery in wooyun (in Chinese) https://paper.seebug.org/papers/Archive/drops2/Xcode%E7%BC%96%E8%AF%91%E5%99%A8%E9%87%8C%E6%9C%89%E9%AC%BC%20%E2%80%93%20XcodeGhost%E6%A0%B7%E6%9C%AC%E5%88%86%E6%9E%90.html